| front |1 |2 |3 |4 |5 |6 |7 |8 |9 |10 |11 |12 |13 |14 |15 |16 |17 |18 |19 |20 |21 |22 |23 |24 |25 |26 |27 |28 |29 |30 |review |

|
Most people
feel comfortable with the concept of life expectancy, a concept I shall
revisit towards the end of the module. However, most people have no idea of
its source or how it is derived. To calculate life expectancy at birth or at
older ages, you first need to construct a life table, a tool that became the
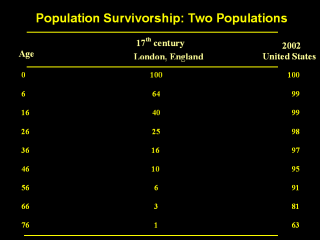
stock-in-trade for actuaries charged with computing life insurance premiums. John Graunt produced the first life table, albeit a very primitive one. His table didnít give us life expectancies, but it did show another important life table function; namely, survival, the probability, for example, that a newborn would survive to age one. Seventeenth century London occupied the first stage of the demographic transition, and Grauntís life table showed that 36% of newborns were projected to perish by six years of age. By contrast, less than 1% of newborns in the United States today would be projected to be dead by age 6. We have come a long way indeed. Sources: Arias, E. United States Life Tables, 2002. National Vital Statistics Reports; 53(6). Hyattsville, MD: National Center for Health Statistics. 2004. Graunt, J. Natural and Political Observations Mentioned in a Following Index and Made upon the Bills of Mortality, in William Petty, The Economic Writings of Sir W. Petty. Vol. 2, ed. C.H. Hull (New York: Augustus M. Kelley, 1964). |